Quality of Service (QoS) refers to a set of techniques and mechanisms that are employed to ensure that the performance and reliability of cloud services meet specific requirements or expectations. QoS is a critical consideration because it enables organizations to deliver consistent and predictable levels of service to their users and applications, even in a shared and dynamic cloud environment. PIACERE, as an integrated DevSecOps framework to develop, verify, release, configure, provision, and monitor infrastructure as code (IaC), has two important modules to ensure that the conditions of the QoS are met at all times and that a failure or non-compliance of Non-Functional Requirements (NFRs) are not likely to occur: the Self-Learning for performance (SL) and the Self-Healing (SH) mechanisms.
These two modules allow to seamlessly embed monitoring mechanisms over the infrastructure that run the applications, and they continuously inspect some critical aspects that indicate situations in which the underlying infrastructure may fail to support the application and to ensure the QoS. In the case of SL, it uses machine learning techniques to allow some prediction capabilities for being able to foresee these situations in advance in order to perform mitigation actions before the application is affected, and thus the users. SH allows to apply short term strategies to minimize the potential consequences in case of SL foresees infrastructure degradations in the short-term.
Self-Learning module: the performance under surveillance
The real-time monitoring process provides SL with a set of different performance monitoring metrics (CPU, disk, memory, and availability). The goal of the SL module for performance is to provide SH with solid short-term predictions of these metrics in real-time. To do that, SL is equipped with a real-time prediction algorithm (online learning). As in any streaming scenario, data streams (metrics) may suffer from different and unexpected, rare events, mainly outliers and the concept drift phenomenon. These events may negatively impact on the quality (performance) of the predictions of the prediction algorithm, so it is necessary to treat them appropriately, otherwise the algorithm would become obsolete and would exhibit a poor performance. For that, SL is also equipped with two different mechanisms.
In the case of outliers, SL is equipped with an outlier detection algorithm which identifies the anomalous data sample, preventing the prediction algorithm from learning it. In the case of drifts appearance, SL is equipped with a drift detector to early detect when the prediction algorithm of the SL needs to be retrained due to e.g. a change in data distribution, and to adapt it to the new nature of data. Thanks to these mechanisms, the SL module for performance has solid predictions of the monitoring metrics, and then it is able to provide SH with reliable warnings. It is worth mentioning that PIACERE has another SL module for security monitoring issues, which will be presented in another post of this blog.
Next, we present the Figure 1 to graphically represent the internal workflow of the performance monitoring components and their internal parts. Based on the request from the user, typically done from the IDE, the PIACERE Runtime Controller-PRC (1) requests the activation of the deployment to the IaC Execution Manager-IEM (2) and to the monitoring stack (3). The IEM deploys the IaC generated by the ICG, that contains the monitoring agents (4). This will create the infrastructure elements required by the application, and these infrastructure elements will contain the monitoring agents. These monitoring agents will provide basic information periodically that will be stored in InfluxDB, a time series database (5). The monitoring stack receives the deployment activation request from the PRC in the monitoring controller (3). It forwards this request to lower-level monitoring components such as performance monitoring controller (6). The performance monitoring controller configures the appropriate dashboards and alerts (7). The dashboard will take care of the visualization of metrics with different purposes, the alerts will take care of the communication of events to the self-healing component.
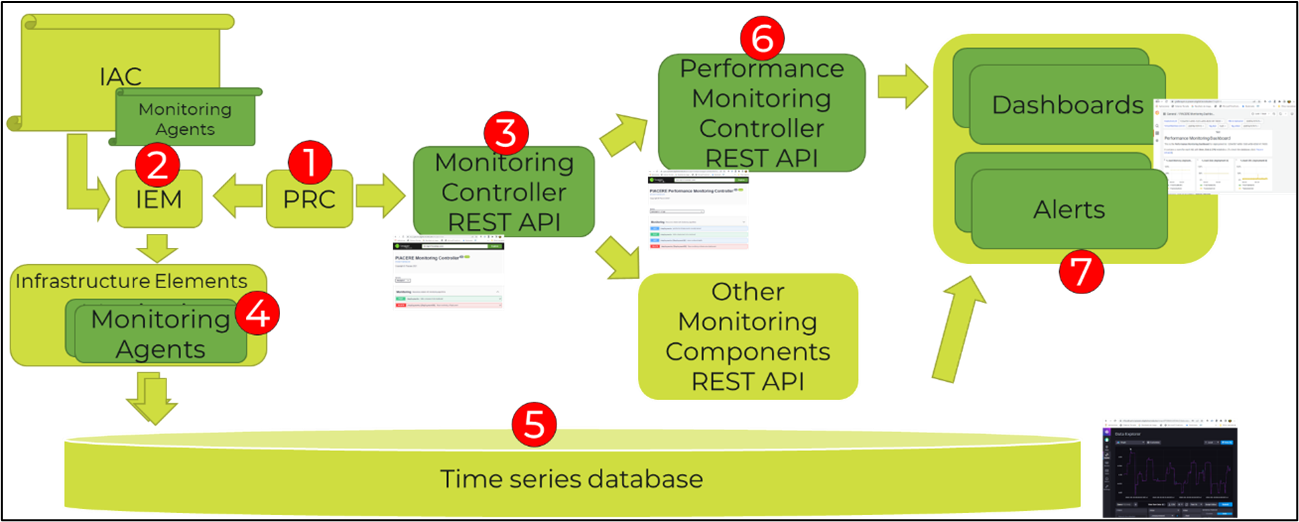
Figure 1: Performance monitoring internal workflow
Once presented the workflow of the monitoring, now it is time to show the SL operation in the Figure 2. The SL module iteratively processes metrics (1). It takes the list of tracked deployments (2), which are loaded by the monitoring controller under request from the PRC. For each active deployment the SL module issues a query to the time series database (3) to retrieve the latest metrics for all the infrastructure elements active in the last period. This can potentially return metric values for several DOML elements: those DOML elements that are defined in the DOML specification and have been available during the last half hour. The processing step starts with checking if the training has been done (4); if the training is not done (5), it checks if enough metrics are in place to create the initial models (training requires a minimum of 200 metric values by default, but this is configurable). After the initial model has been generated, each follow up metric value is used in the online learning and prediction algorithm (6) that also considers anomalies and drifts. Besides, that information is stored back in the time series database (7) for its latter usage in the metrics’ visualization (8) and alerts’ issuing for the procedures of the SH module.
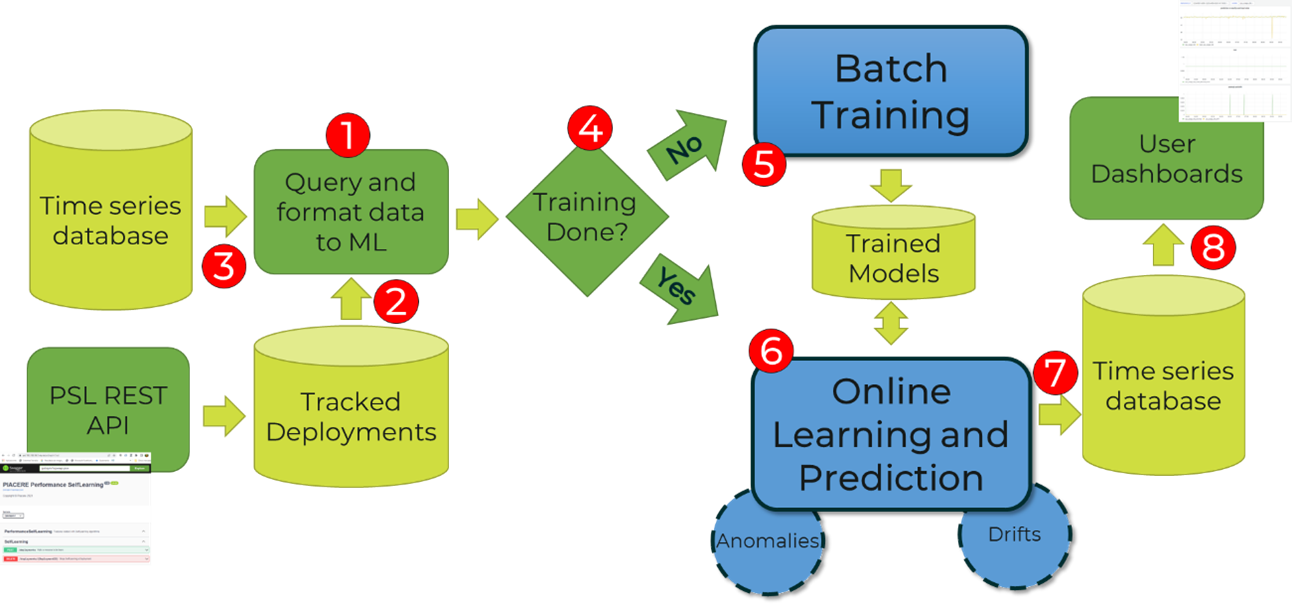
Figure 2: Workflow of the Self-Learning module.
Self-Healing module: the surgeon
The goal of the SH module is to react to situations detected by the SL modules (performance and security monitoring), applying a set of different strategies (see Figure 3).
The overall flow starts with the reception of events (1) from the monitoring components, specifically performance and security. Once an event is received (2) through an asynchronous method, it is queued for processing. An executor process takes events from the queue and process them. For each event received, a strategy to apply is identified (3) and selected based on three sources with different priority on a deployment basis:
- Higher priority are the strategies specified in the DOML, these are applicable on a deployment basis
- Normal priority are the strategies predefined in the SH module
- Default is the notify strategy
Then each strategy is executed following its own flow, which may involve the communication with external components (4), such as PRC.
Based on such strategy, different workflows and interactions will be executed:
- Notify: sends a message to the PIACERE administrator, unless redefined based on monitoring rules
- Redeploy: it will request the PRC to redeploy the deployment
- Scale: it will modify the DOML to scale the infrastructure following the provided configuration.
- Ansible: it will execute an Ansible playbook for the deployment. The playbook to be executed.
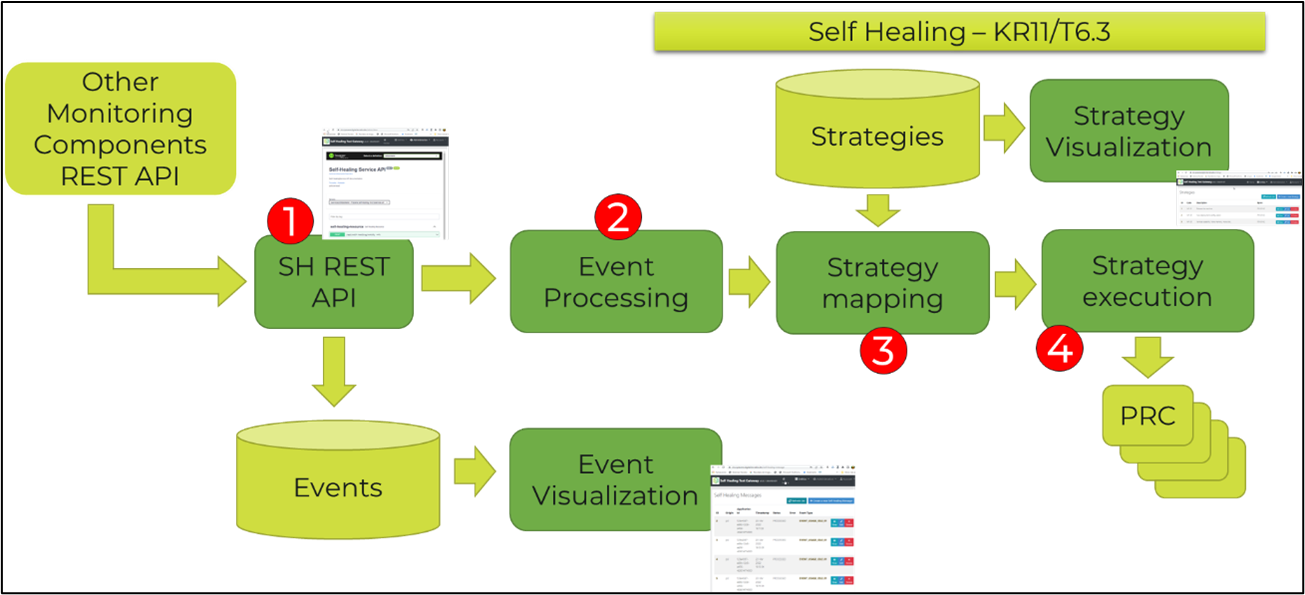
Figure 3: Workflow of the Self-Healing module.
0 Comments